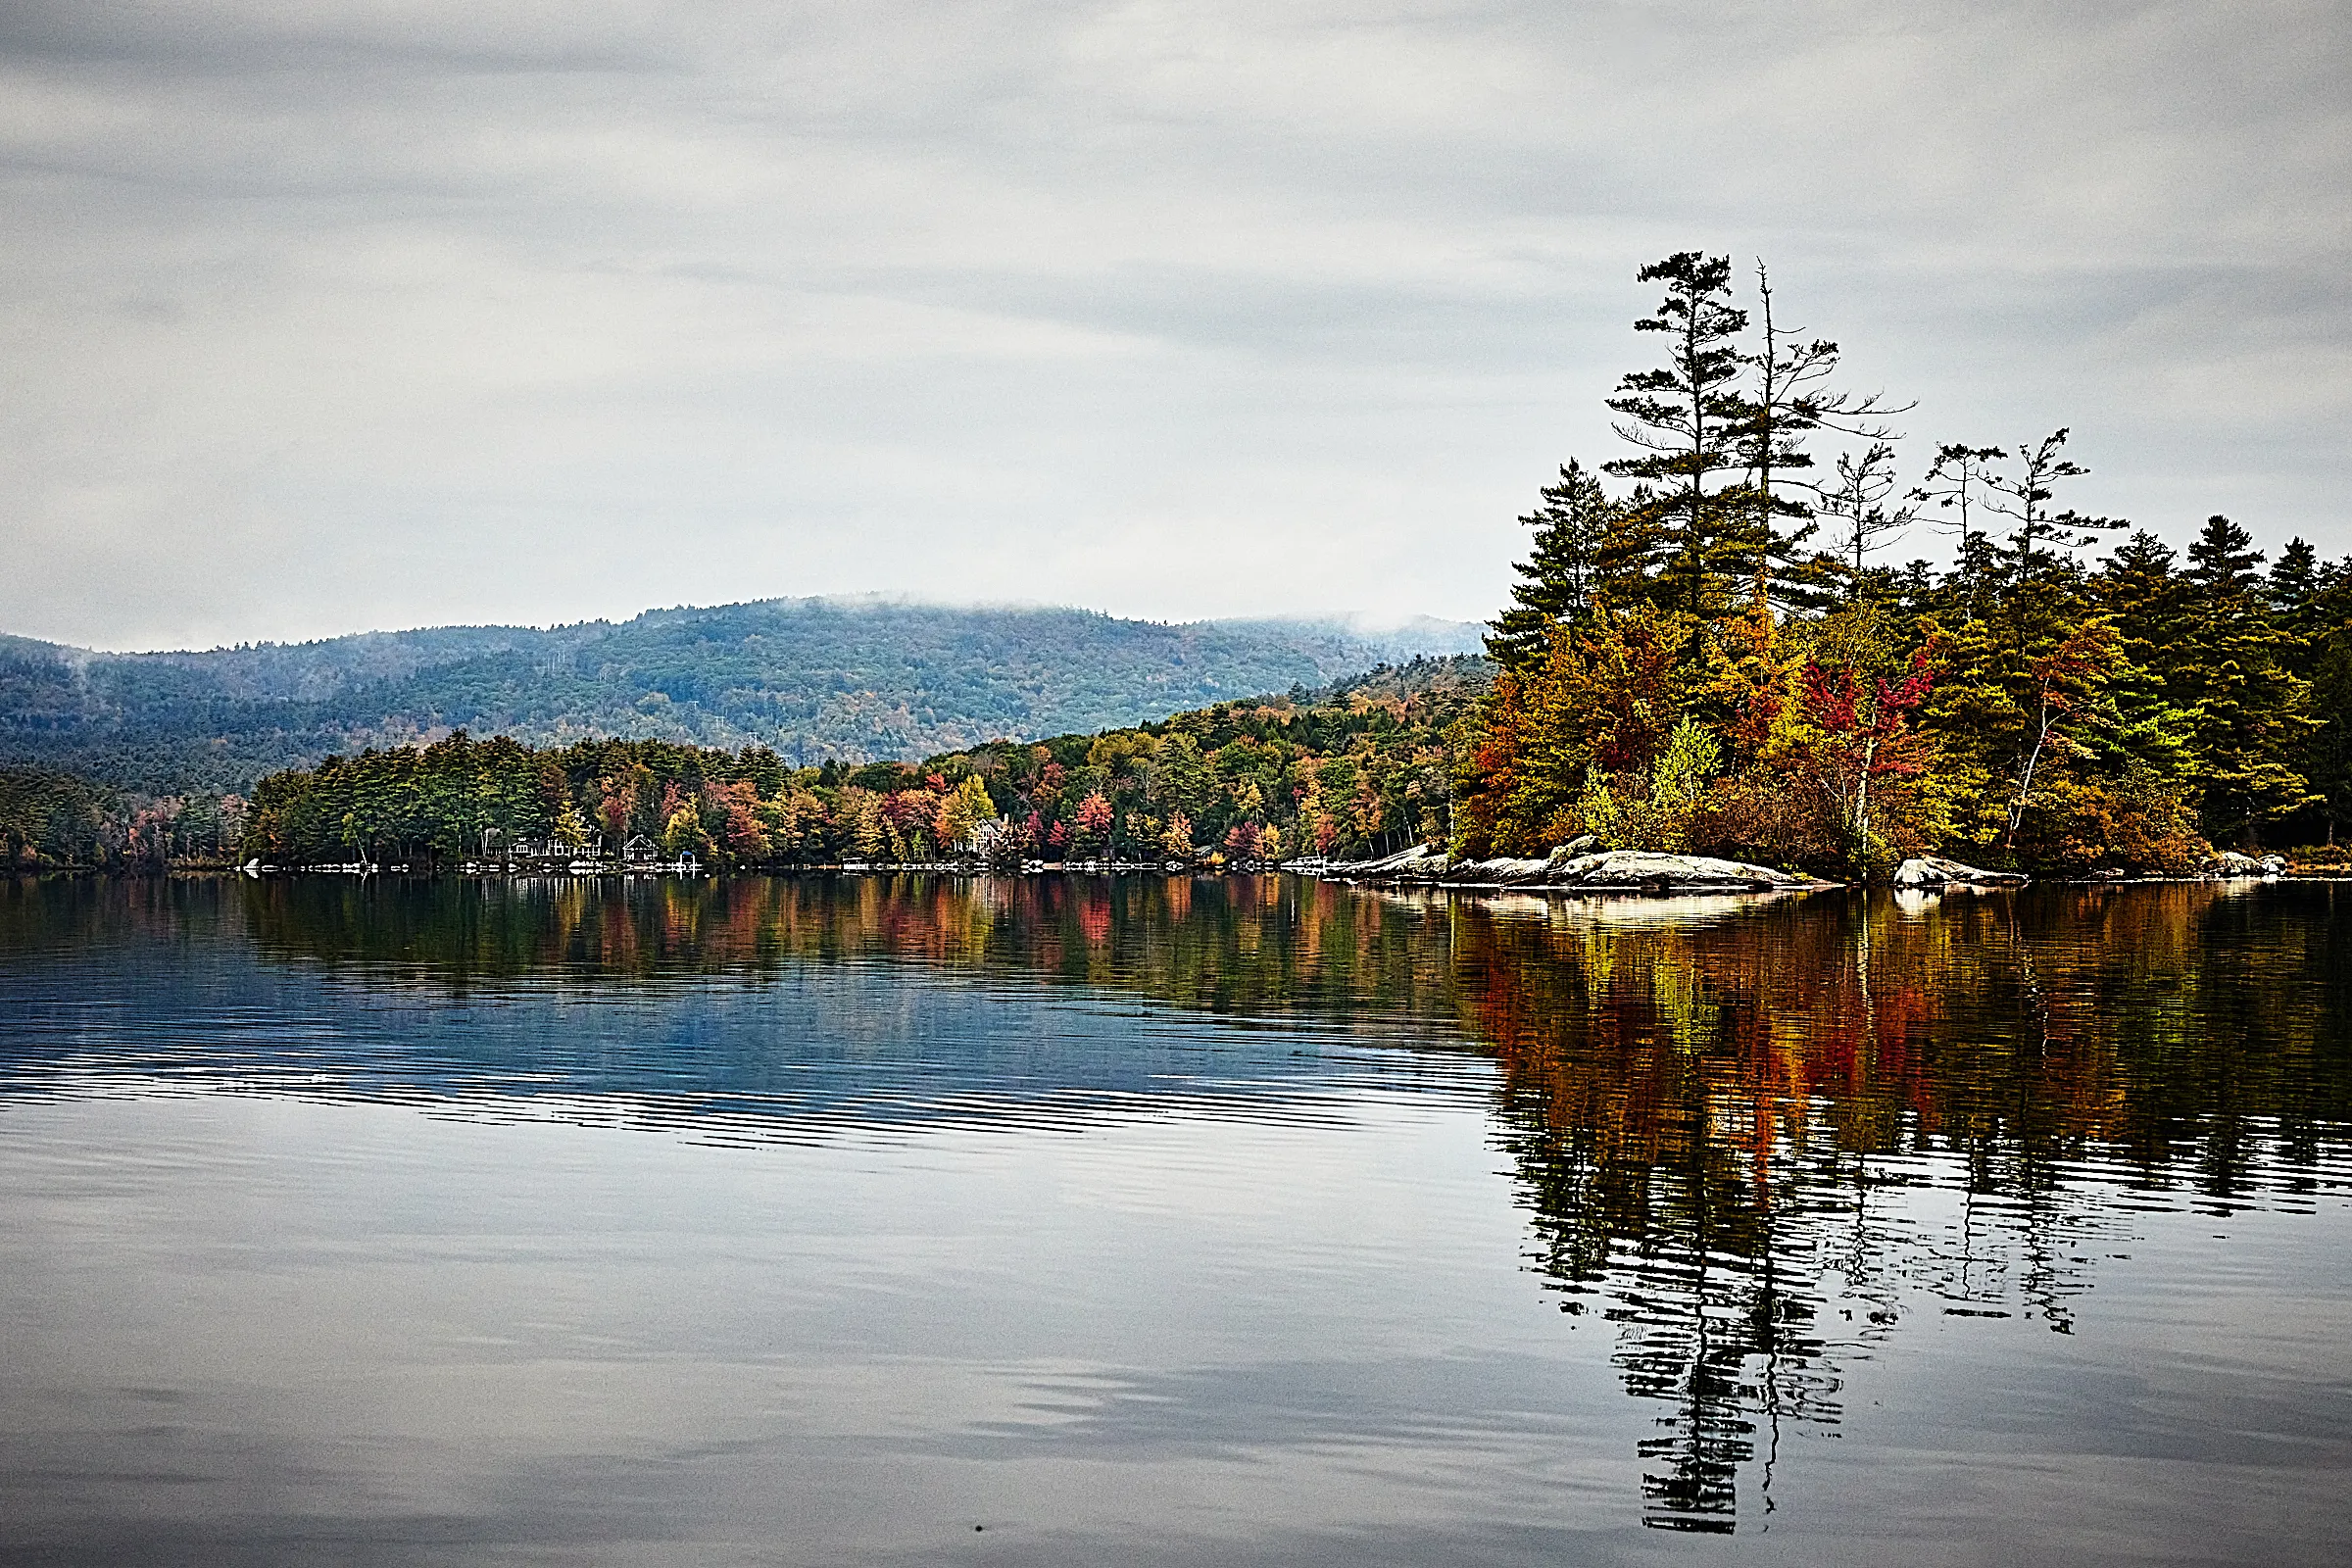
Lake at a Glance
Lake Chart
The bathymetric chart shows depth contours across the full lake basin.
Historical Reference Only
This 1966 bathymetric chart is considered historical and inaccurate for modern navigation or precise depth measurement. It is provided for general interest only.
Depth Contours
The lines on the chart represent depth intervals. Closely spaced lines indicate a steep drop-off; widely spaced lines indicate a gradual slope.
Public Access
The primary public boat launch is at the Elkins Dam site. Please observe all posted rules and clean, drain, and dry your boat before launching.
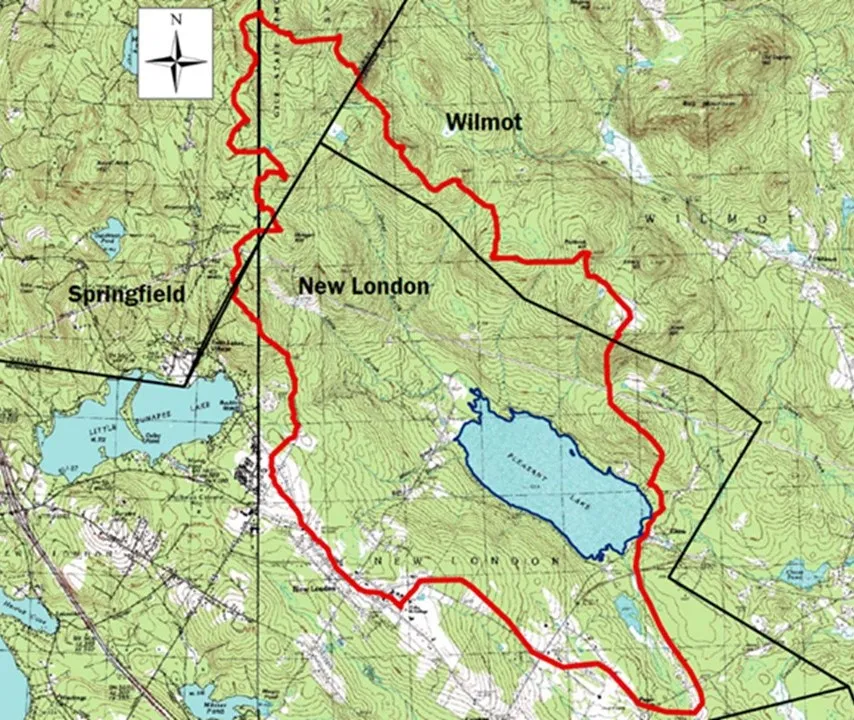
Invasive Species PreventionWatershed Chart
The Pleasant Lake watershed area, showing the land catchment that drains into the lake.
Pleasant Lake's watershed is highlighted in red on the map below.
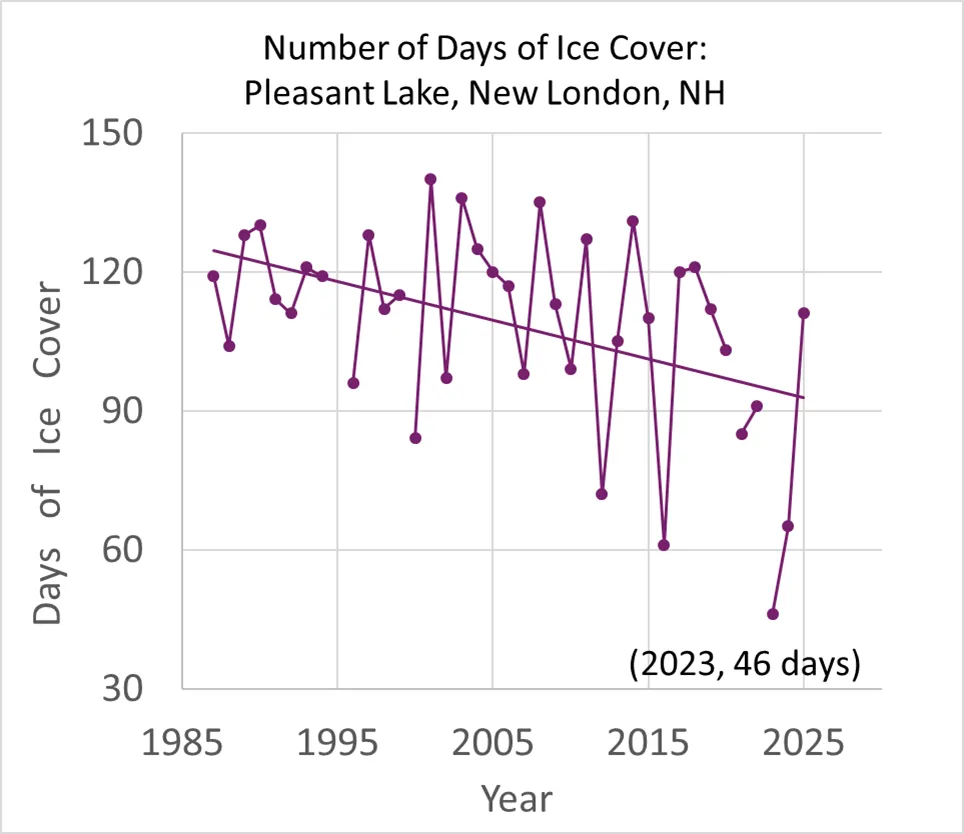
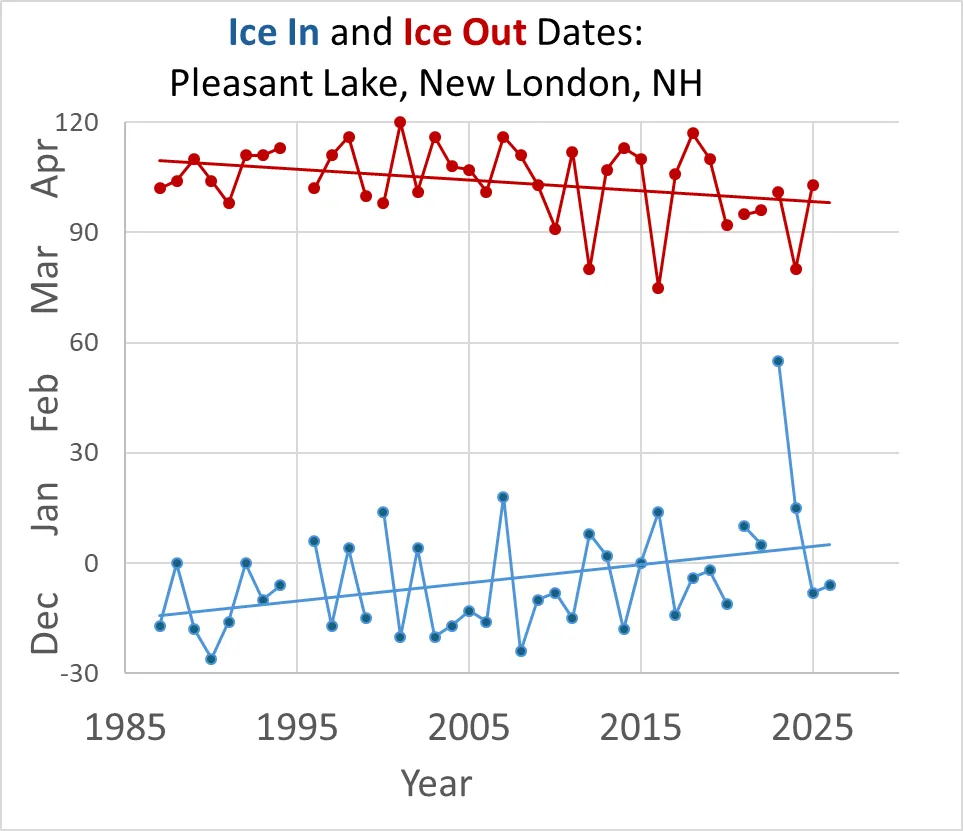
Ice Cover & Ice-Out Data
Ice-out dates and ice cover duration are tracked each year at Pleasant Lake. The data shows a clear long-term decline in ice cover duration — from roughly 4 months in the 1980s to 3 months in recent years. In 2023, ice cover lasted only 46 days.
| Year | Ice-Out Date | Year | Ice-Out Date |
|---|---|---|---|
| 2006 | April 2 | 2017 | April 16 |
| 2007 | April 26 | 2018 | April 27 |
| 2008 | April 21 | 2019 | April 20 |
| 2009 | April 13 | 2020 | April 2 |
| 2010 | April 2 | 2021 | April 5 |
| 2011 | April 22 | 2022 | April 6 |
| 2012 | March 22 | 2023 | April 12 |
| 2013 | April 17 | 2024 | March 21 |
| 2014 | April 22 | 2025 | April 13 |
| 2015 | April 21 | 2026 | April 12 |
| 2016 | March 17 |